You want to lower your resting heart rate. 50 to 45. You give yourself eight weeks, a Zone 2 target, one HIIT session per week. An hour later, you have a dashboard—vibe-coded or hand-built, doesn’t matter. Minutes logged. Weekly targets. A progress bar that fills up as you do the work.
Week 1: 83 minutes of Zone 2. On pace. Week 2: 200. Ahead of schedule. It feels good to see the numbers climb.
But the dashboard is answering a question you didn’t mean to ask. “Am I doing the work?” Yes. You are. That was never in doubt. The question that actually matters—is the work doing anything?—the dashboard can’t touch.
Back up. Before the protocol. Before the first treadmill session.
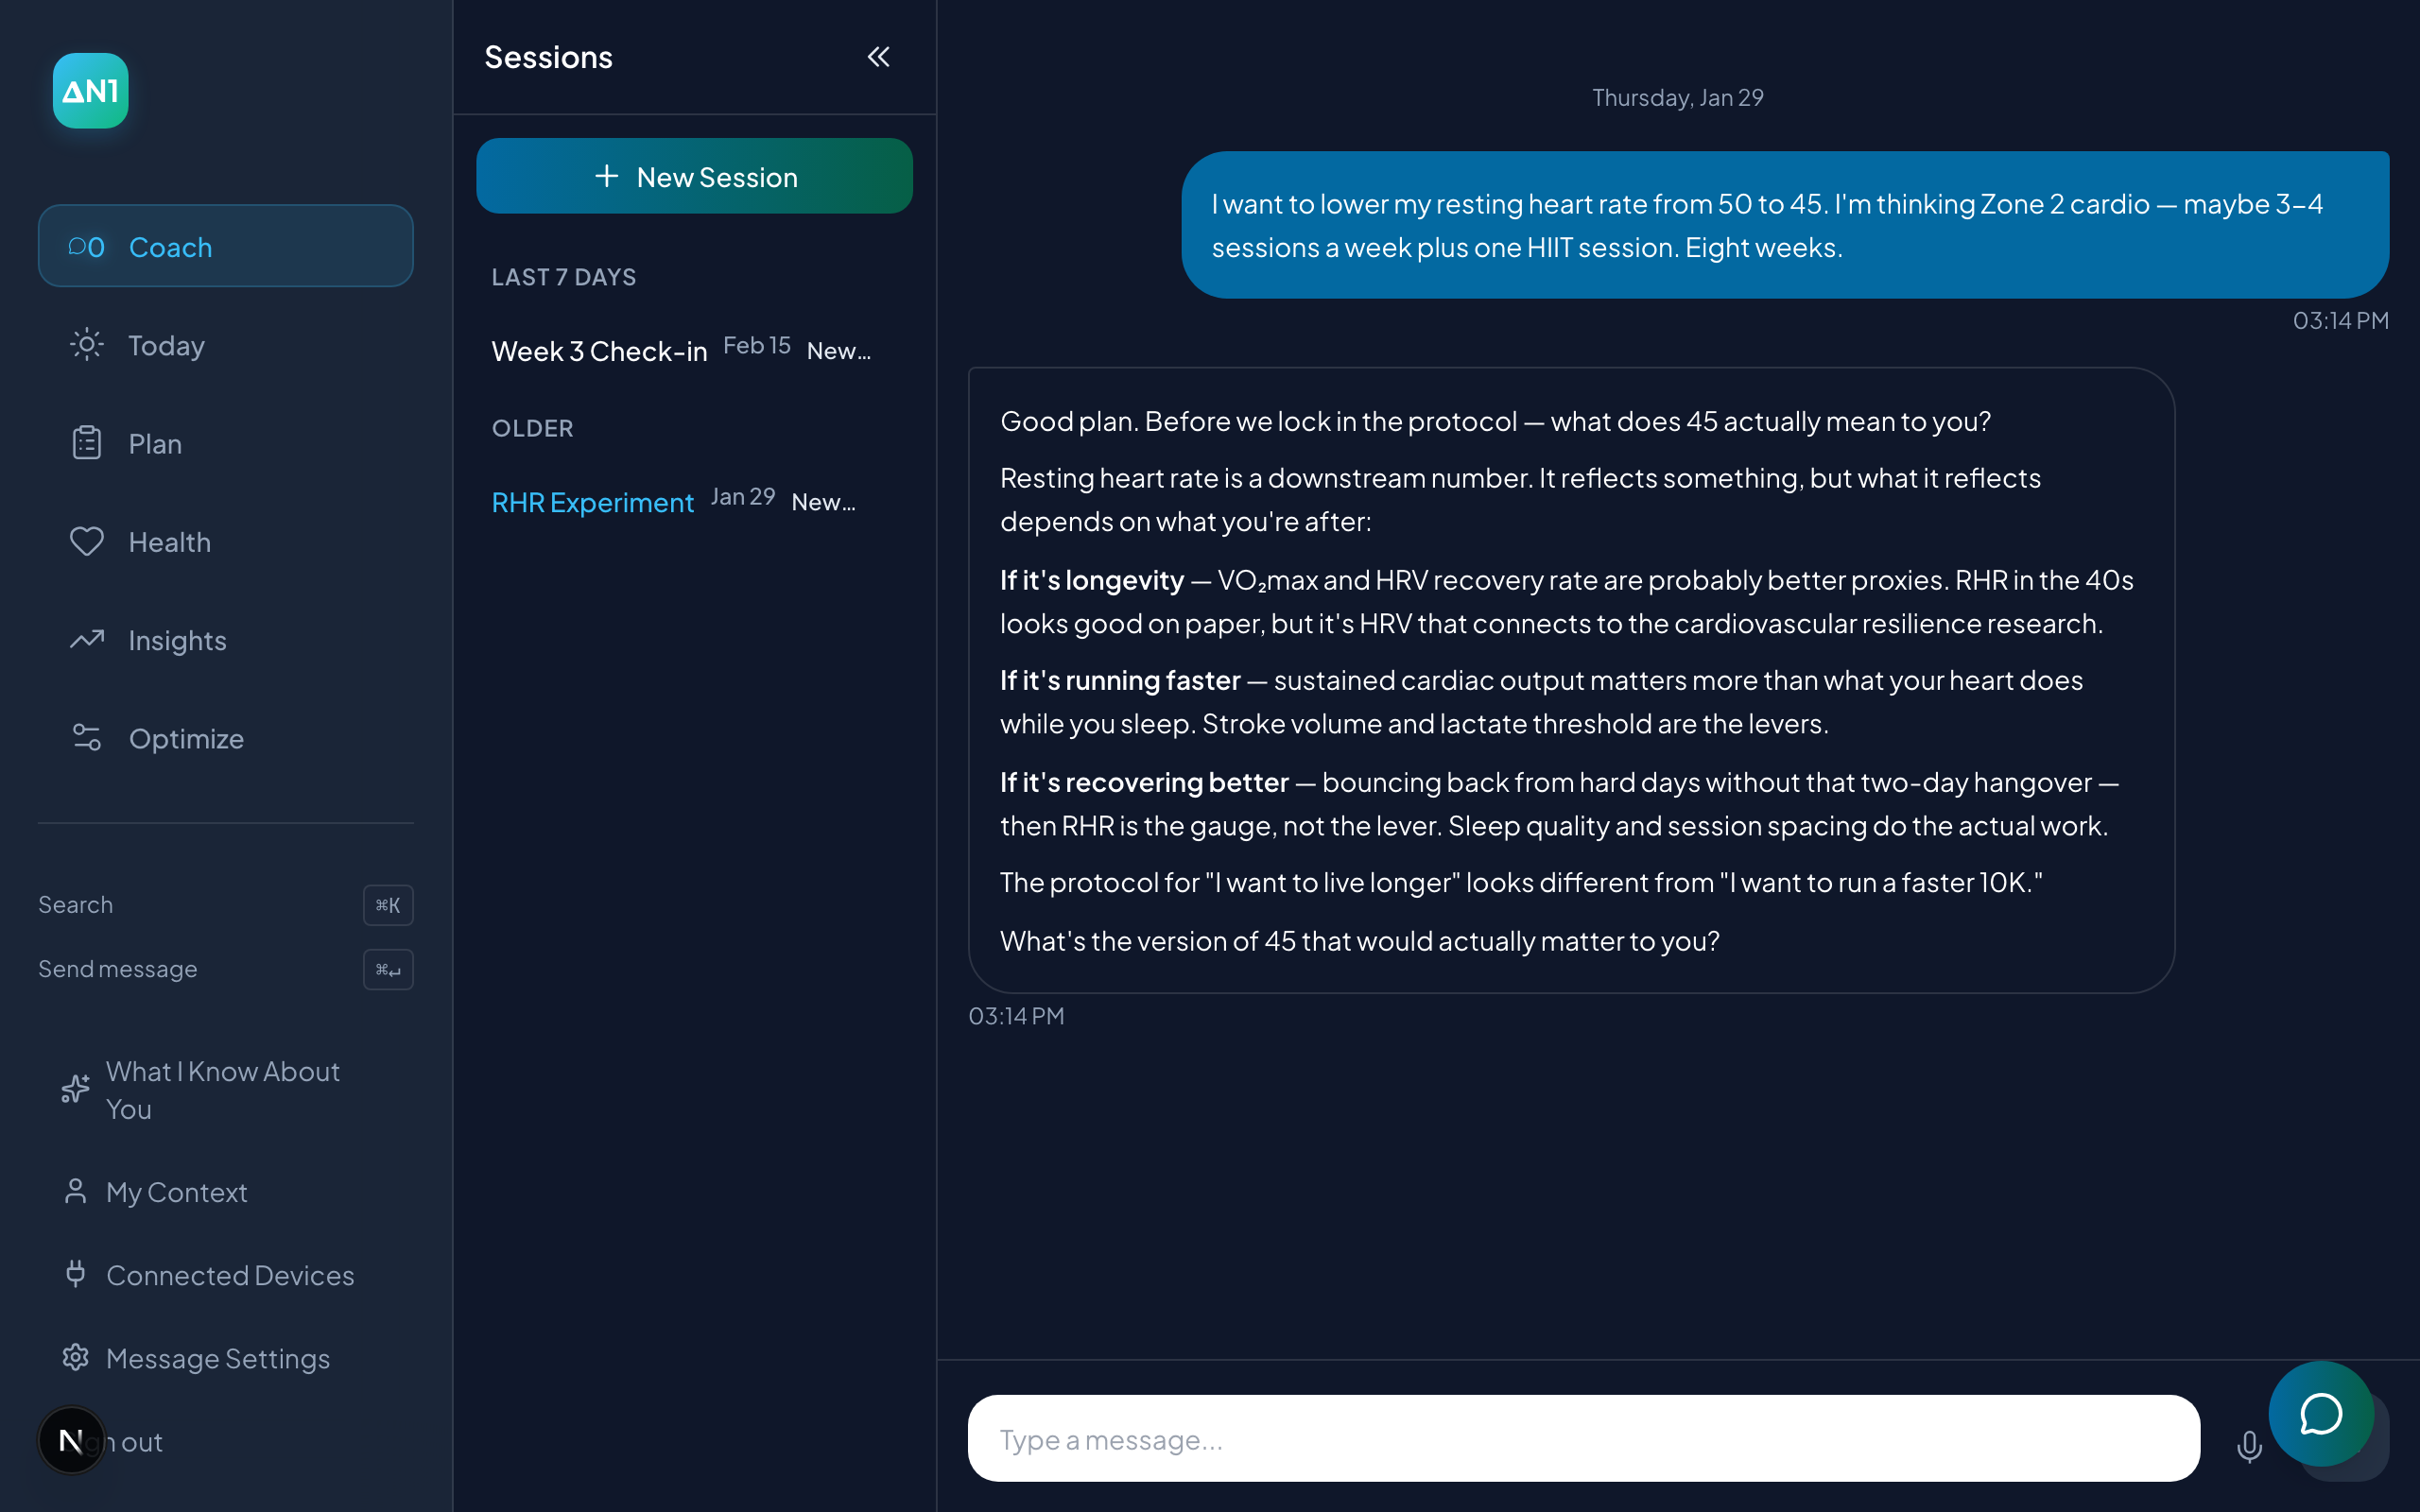
Why 45?
Nobody wants a lower number on a watch face. The number stands for something. But what? If you’re chasing longevity, VO2max and HRV recovery rate are probably better proxies than resting heart rate. If it’s about running faster, sustained cardiac output matters more than what your heart does while you sleep. If it’s about recovering better—bouncing back from hard days without that two-day hangover feeling—then RHR is downstream. Sleep and stress are the levers. RHR is just the gauge.
The protocol for “I want to live longer” looks different from the protocol for “I want to run a faster 10K.” But the dashboard doesn’t know which one you mean. It just counts minutes.
Three weeks in. You’re consistent. The progress bar is green.
Meanwhile, something interesting is happening in your data that no progress bar would show.
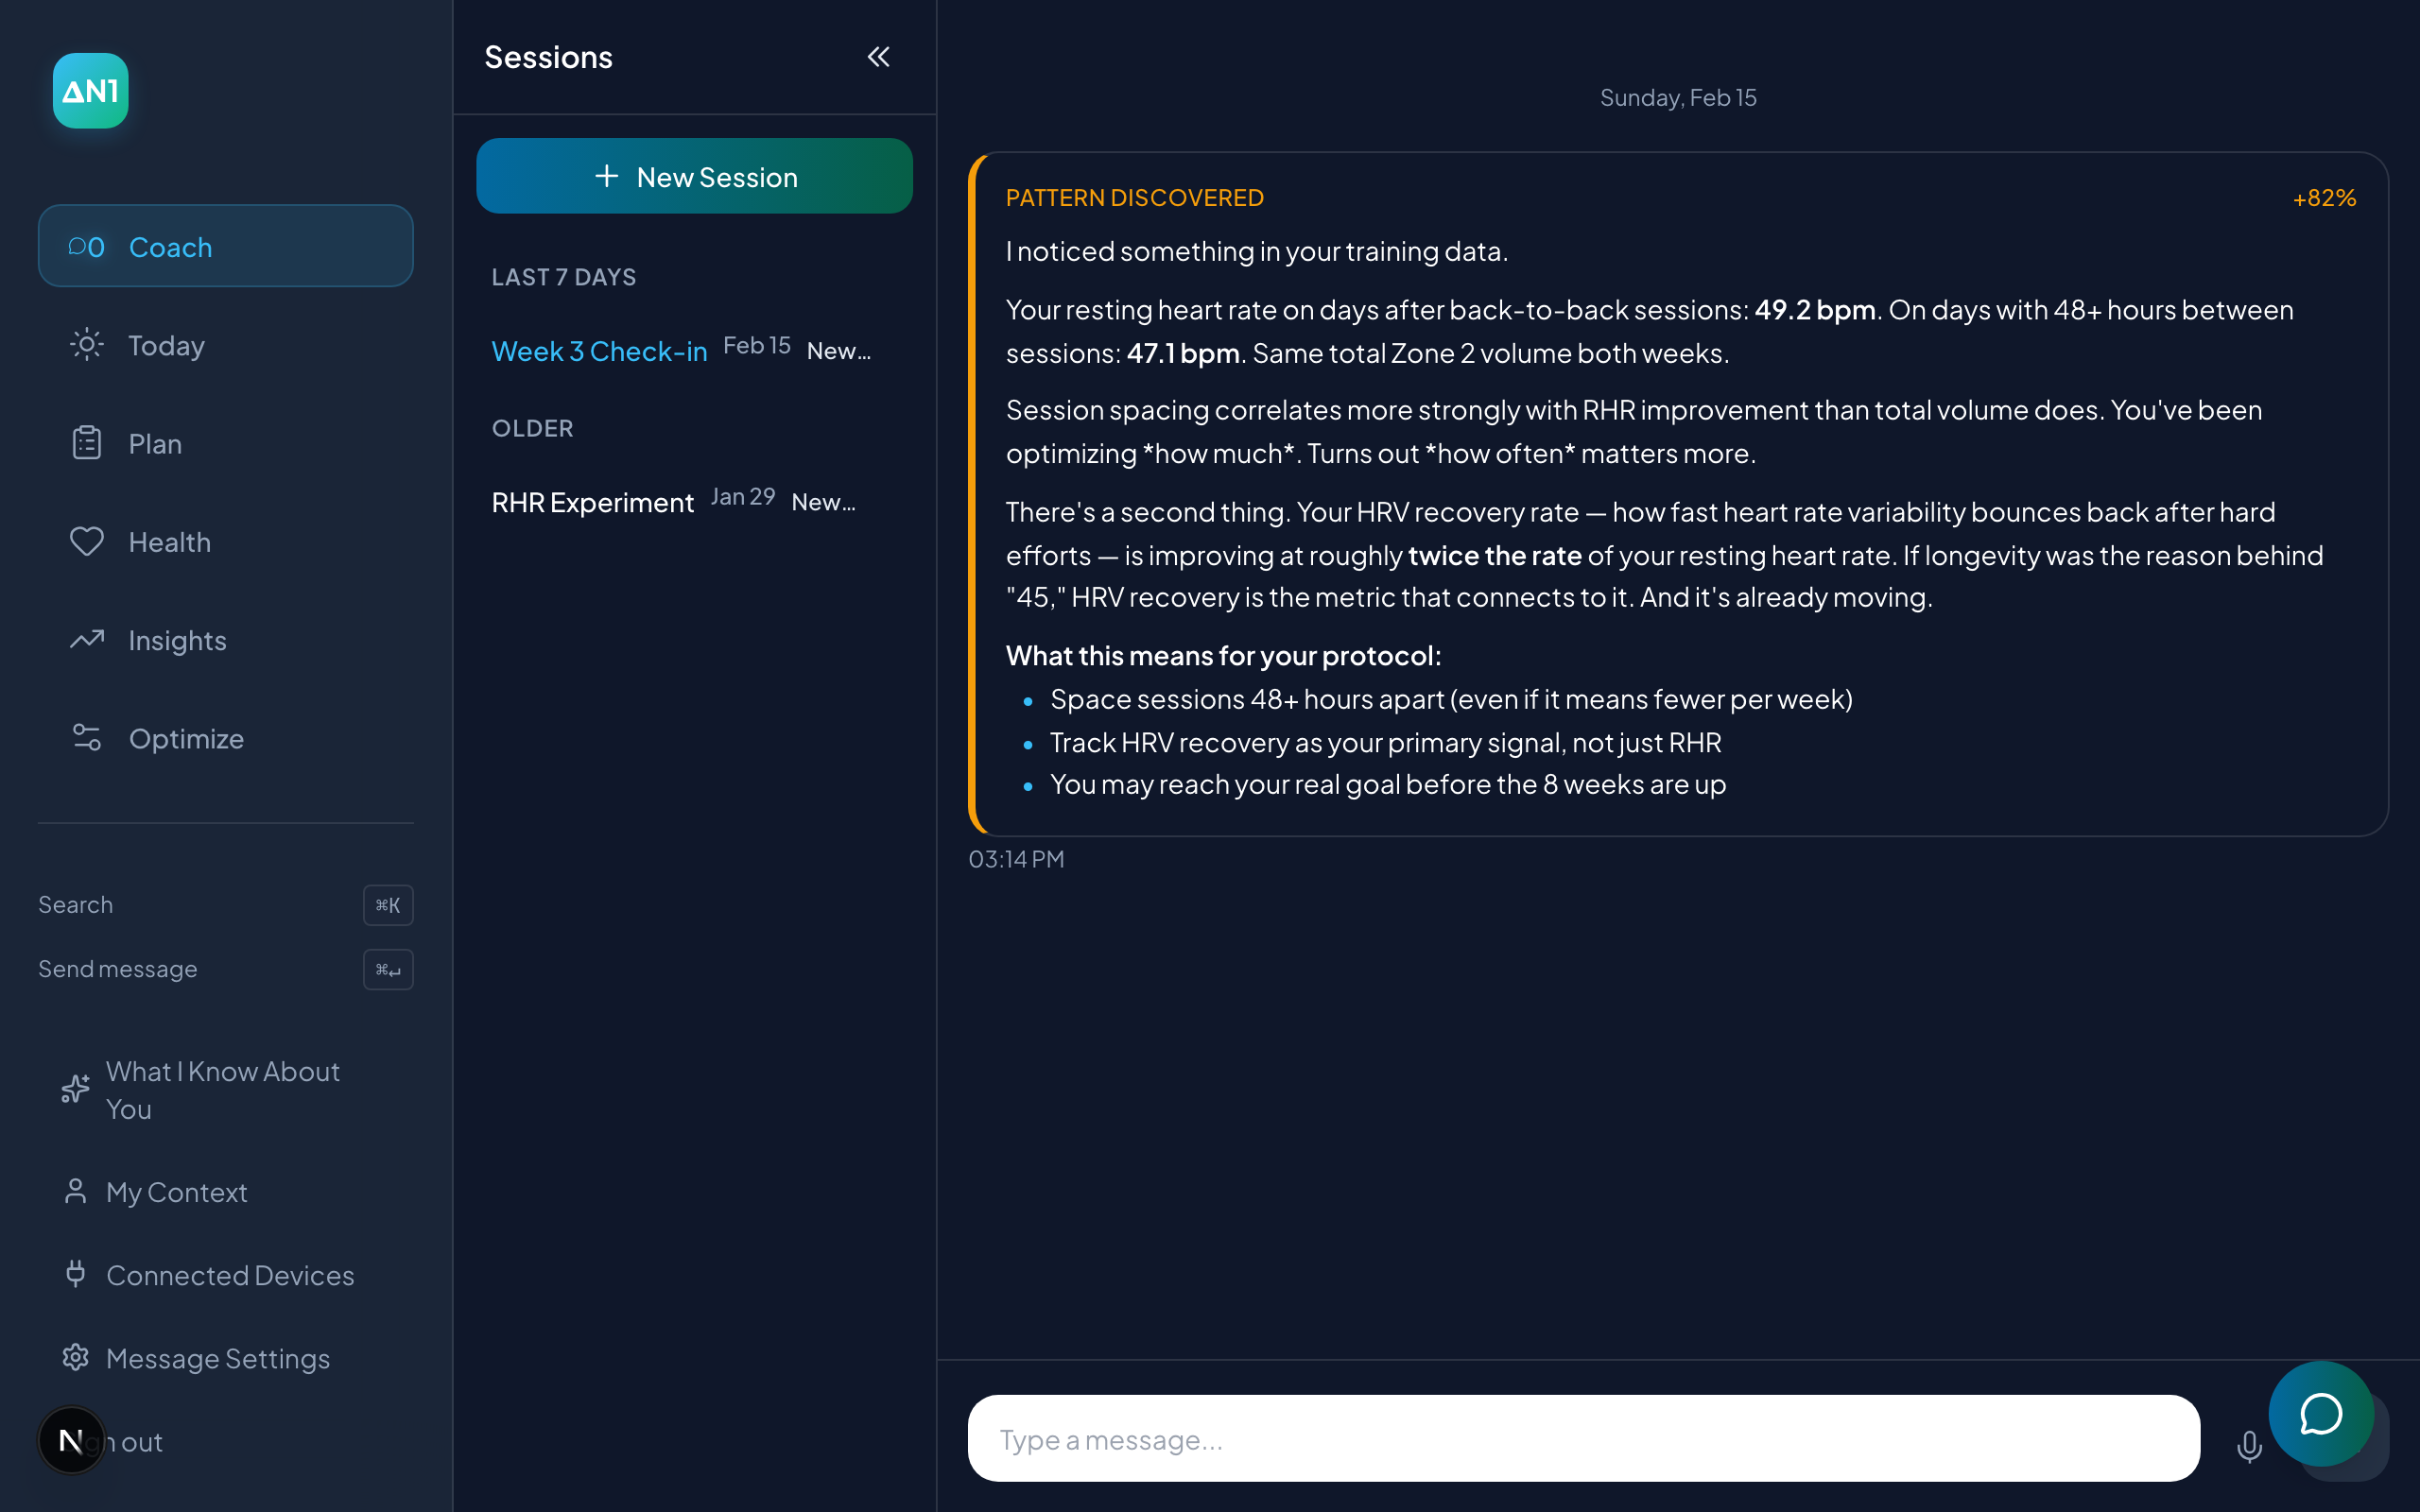
Your resting heart rate on days after back-to-back training sessions: 49.2. Your resting heart rate on days with 48+ hours of recovery between sessions: 47.1. Same total volume. Same weekly Zone 2 minutes. But the spacing between sessions is doing more work than the sessions themselves.
You’ve been optimizing how much. Turns out how often matters more.
There’s a second thing. Your HRV recovery rate—how fast your heart rate variability bounces back after hard efforts—is improving at roughly twice the rate of your resting heart rate. If longevity was the reason behind “45,” HRV recovery is the metric that connects to it. And it’s already moving.
None of this shows up on a dashboard that counts Zone 2 minutes.
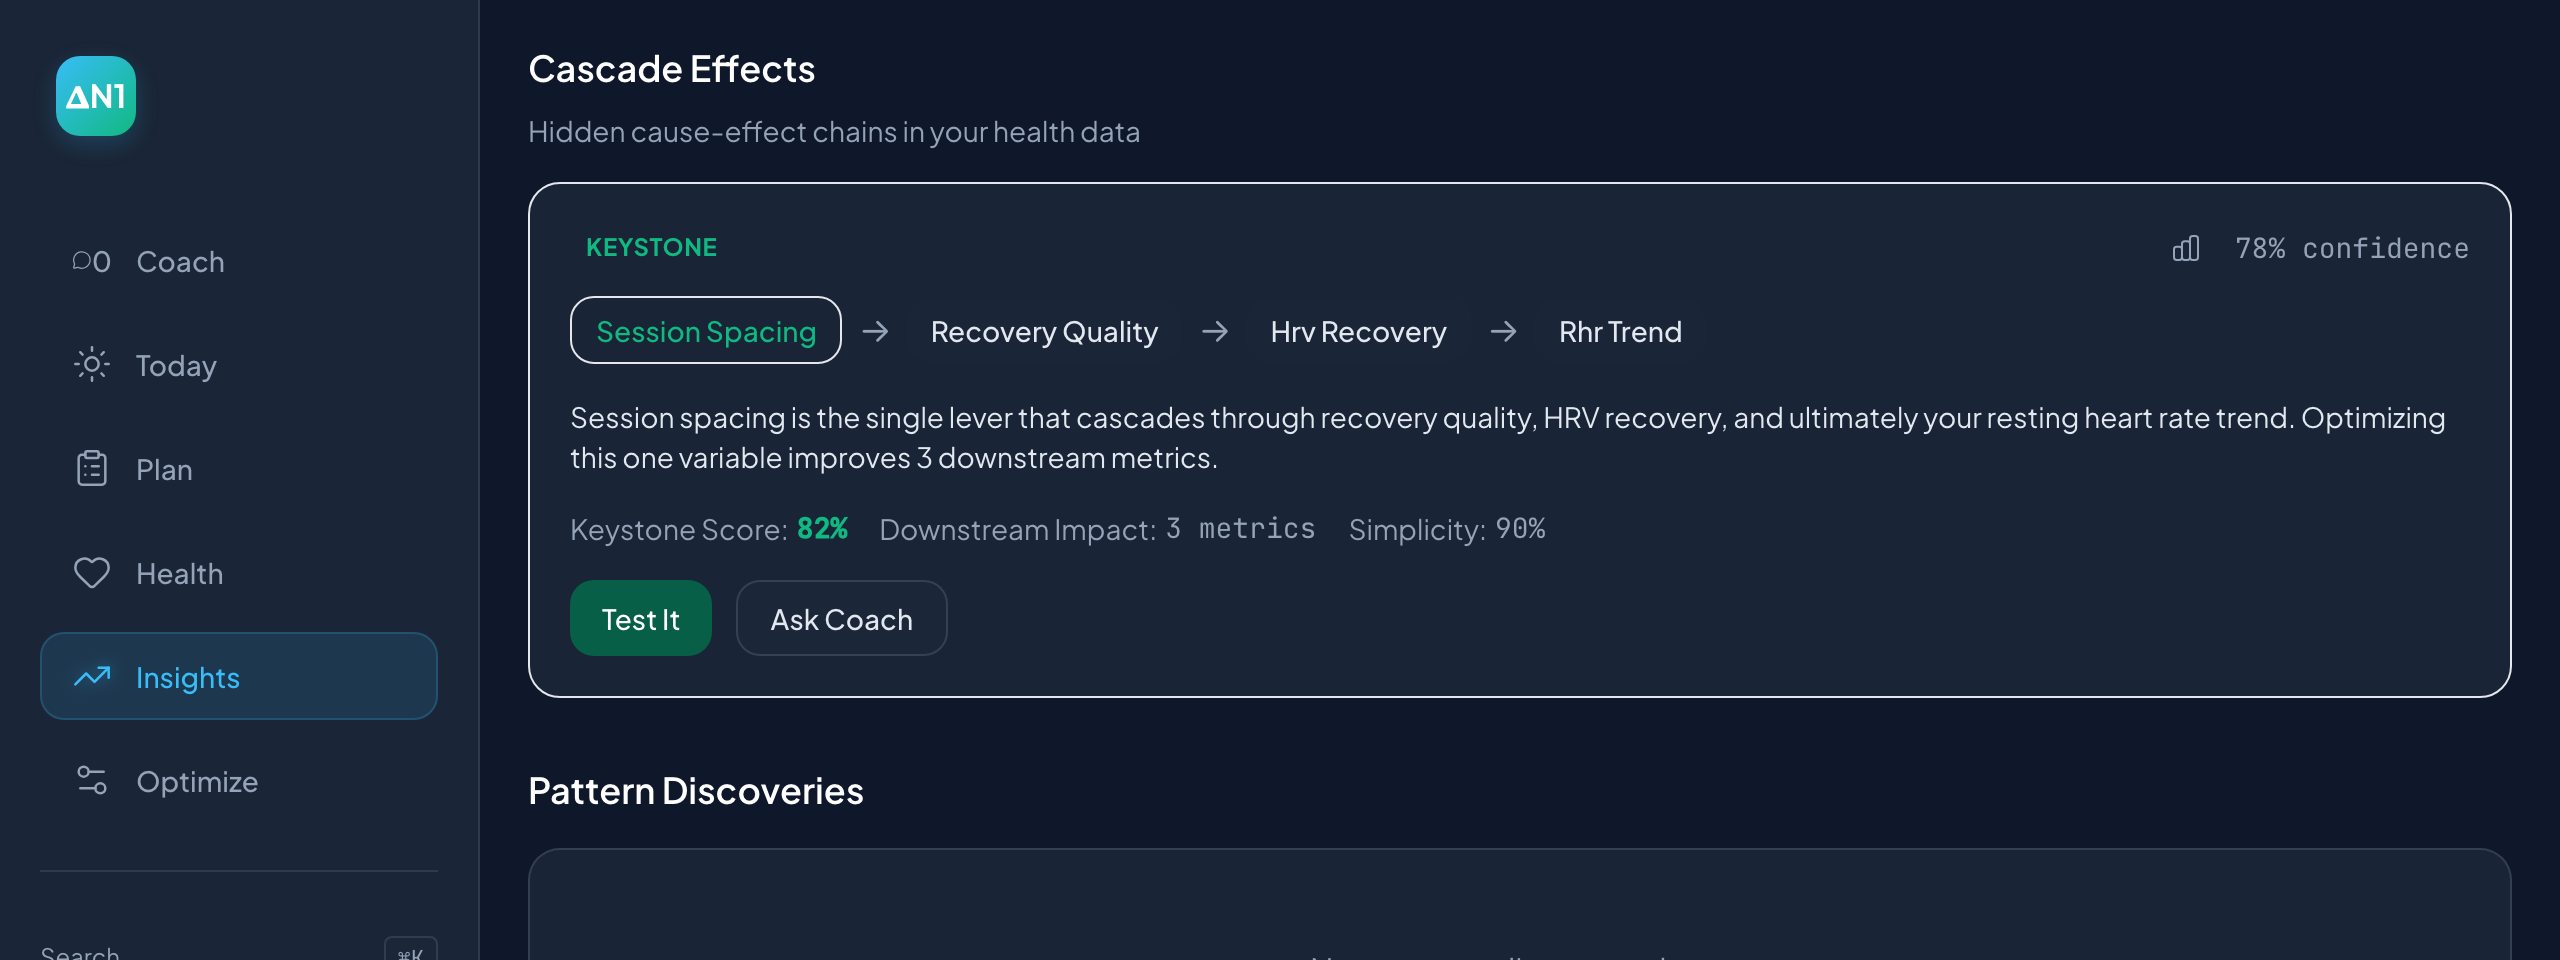
Here’s what this actually looks like when you trace the chain.
Session spacing → better overnight recovery → higher morning HRV → lower resting heart rate. But also: sleep quality feeds into that same recovery step. So on nights you sleep poorly, the spacing advantage shrinks. Two variables, one shared bottleneck, and a confounder you weren’t tracking.
That chain is testable. Each link either holds or it doesn’t. And when one link turns out to be weaker than expected—say, the Zone 2 volume itself contributes less than you assumed—you don’t need to throw out the whole experiment. You adjust the variable that matters and keep going.
Maybe the 8-week experiment resolves in five. Maybe the answer is “Zone 2 works, but only with 48-hour spacing and decent sleep.” Maybe the answer is “forget RHR—your HRV recovery rate is a better target for what you actually want.”
You wouldn’t get any of that from a progress bar. You’d get a green checkmark at week 8 and no idea whether the number moved because of Zone 2, because of something else, or because resting heart rate just drifts around on its own.
Three hundred lines of code will get you a dashboard. An LLM can generate it in an hour. That part is solved.
The part that isn’t solved: knowing whether you’re chasing the right number. Knowing whether the protocol is the reason behind the result. Knowing when to adjust, when to stop, and when the thing you thought mattered turns out to be downstream of something you weren’t paying attention to.
That’s not a dashboard problem. That’s what happens when the system remembers what you told it in week one, watches what actually changes, and connects the two—even when the connection isn’t the one you expected.